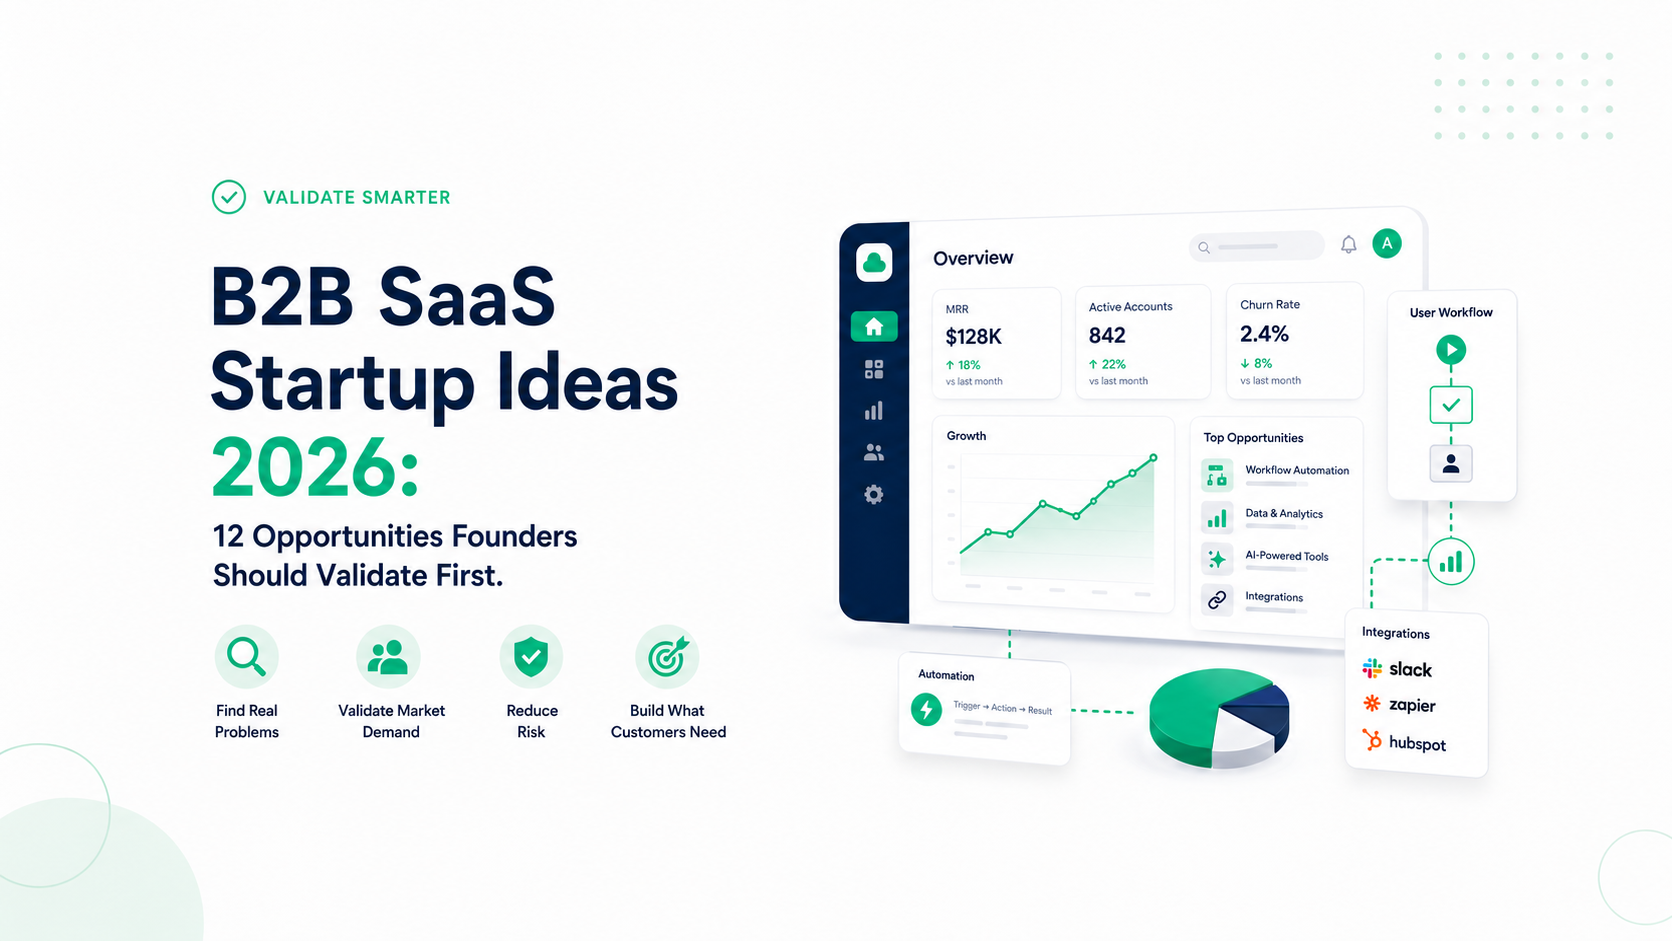
Learn what investors actually consider a "good" TAM, how TAM expectations differ by funding stage and industry, real benchmarks for SaaS, fintech, healthtech, e-commerce, marketplaces, and more — plus how to avoid the most common TAM mistakes that kill investor confidence.
"Our TAM is $50 billion."
That sentence appears in roughly half of all startup pitch decks, and it tells investors almost nothing. A large number plucked from a Statista report doesn't demonstrate market understanding. It demonstrates a Google search.
The question founders should actually be asking isn't "how big is our TAM?" — it's "is our TAM the right size for what we're trying to build, and can we prove it?" Because here's the counterintuitive truth: a TAM can be too big just as easily as it can be too small. Both signal problems. A TAM that's too enormous suggests the founder hasn't thought carefully about their specific market. A TAM that's too small suggests the business has a ceiling that won't support the growth investors need.
The sweet spot — what one prominent VC firm calls the "Goldilocks TAM" — depends on your industry, your funding stage, your business model, and what kind of company you're trying to build. A venture-backed SaaS startup needs a fundamentally different TAM than a bootstrapped niche product, and a Series A healthtech company faces different expectations than a pre-seed consumer app.
This guide breaks down what "good" actually means for TAM across different industries and stages, with real benchmarks, examples, and the frameworks investors use to evaluate whether your market size makes sense.
What Is TAM? A Quick Refresher
Total Addressable Market (TAM) represents the total revenue opportunity available for your product or service if you achieved 100% market share with zero competition. It's a theoretical ceiling — the absolute maximum size of your market.
TAM is not a forecast. It's not what you expect to earn. It's the broadest possible view of your market opportunity, and it serves a specific purpose: showing investors that the market is large enough to support the kind of business they need you to build.
There are two primary ways to calculate it:
Top-down: Start with a broad industry figure from a research report (Gartner, Statista, IBISWorld) and narrow it to your relevant segment. Fast but often too abstract to be credible on its own.
Bottom-up: Count the number of potential customers in your target market and multiply by your average annual revenue per customer. More work, but far more defensible.
For a thorough walkthrough of both calculation methods with formulas and examples, see our guide on How to Calculate TAM, SAM, and SOM. This article focuses specifically on what size TAM investors expect across different industries and stages.
What Investors Actually Look For in Your TAM
Before diving into benchmarks, it's essential to understand the investor's perspective. VCs don't just want a big number. They're running mental math on whether your TAM supports a venture-scale outcome.
The Exit Math
Venture capital funds need to return 3-5x the total fund size to their limited partners. Individual investments need to return 10x or more to compensate for the majority of portfolio companies that fail. This math cascades directly into TAM expectations.
Here's how an investor thinks about it: If a successful company can realistically capture 5-20% of its TAM over time, and the investor needs the company to reach $100M+ in annual revenue to justify a billion-dollar exit, then the TAM needs to be at least $500M-$2B for the math to work. For funds targeting even larger outcomes, the TAM floor is higher.
This is why a $50 million TAM — even if it's perfectly accurate and well-researched — will struggle to attract venture capital. The ceiling is too low. Even if you dominate the market, the outcome isn't large enough for a VC's return model.
The Goldilocks Zone
Investors talk about a TAM being "too small," "too big," or "just right."
Too small (under $500M): The market ceiling limits growth potential. Even with perfect execution, the company can't reach the scale investors need. This doesn't mean it's a bad business — it might be an excellent bootstrapped or angel-funded company — but it's unlikely to attract institutional venture capital.
Too big (over $100B without specificity): When a founder claims a TAM of $200 billion, investors get suspicious. It usually means the founder defined their market too broadly. A budgeting app claiming the entire fintech TAM of $300 billion is not credible — budgeting apps are a small slice of fintech. Overly large TAMs signal lazy analysis, not large opportunity.
Just right ($1B-$30B for most venture-backed startups): Large enough to support venture-scale outcomes, specific enough to be credible. The founder has clearly identified who their customer is, what they're willing to pay, and how many of them exist.
TAM Is a Story, Not Just a Number
Experienced investors evaluate TAM not just by its size but by the logic behind it. They want to see that you understand which specific customers make up your TAM, how you arrived at the number (preferably bottom-up), how the market is growing and why, where the TAM boundary is and what could expand it over time, and how your TAM relates to your SAM and SOM in a logical cascade.
A $3 billion TAM with a clear bottom-up derivation, a growing market trend, and a credible path from SOM to SAM expansion is far more compelling than a $50 billion TAM pulled from an analyst report with no connection to your actual product.
TAM Benchmarks by Funding Stage
What counts as a "good" TAM shifts dramatically depending on where you are in your fundraising journey.
Pre-Seed and Seed Stage ($500M - $1B+ TAM)
At the earliest stage, investors are primarily betting on the team and the problem. TAM expectations are the most flexible here because the product and market positioning are still being defined.
However, investors still need to see that the opportunity is large enough to justify the risk. A TAM of $500 million is generally the floor for pre-seed and seed-stage venture investors. Below that, you'll hear "this seems like a great small business, but not a venture opportunity."
At this stage, investors are more forgiving about how precisely you've calculated your TAM. A reasonable top-down estimate supplemented by a thoughtful bottom-up analysis is usually sufficient. What matters more is that you've identified a real problem in a market that's clearly large enough.
What works at this stage:
"The US market for construction project management software is approximately $1.2 billion, based on 400,000 general contractors spending an average of $3,000/year on project management tools. This market is growing at 12% annually as the industry digitizes."
What doesn't work:
"The global construction industry is $10 trillion. If we capture just 0.01%, that's $1 billion."
Series A ($1B - $10B+ TAM)
By Series A, investors expect a much more rigorous TAM analysis. You should have customer data, revenue metrics, and a clear understanding of your unit economics. Your TAM should be built bottom-up from actual customer counts and validated pricing.
The typical TAM expectation for Series A is $1 billion or above. Many VCs set $1B as a hard minimum, reasoning that anything smaller makes it mathematically difficult for the company to reach the $100M+ revenue needed for a meaningful exit.
At this stage, your TAM should also tell an expansion story. Maybe your current product addresses a $1.5 billion market, but your product roadmap expands into adjacent segments worth another $3 billion. Investors want to see both where you are today and where you could be in five years.
Series B and Beyond ($5B - $30B+ TAM)
At growth stage, the bar is highest. Investors are writing larger checks and need proportionally larger outcomes. TAMs of $5 billion and above are typical expectations, with many growth-stage investors preferring $10B+ markets.
At this point, your TAM should be supported by your own traction data. If you've captured 0.5% of a $5 billion market and you're growing 100% year-over-year, investors can model the path to 5-10% market share and determine whether the return potential meets their threshold.
TAM Benchmarks by Industry
Now let's get specific. TAM expectations vary significantly by industry because market structures, pricing models, competitive dynamics, and growth rates differ across sectors. Here are benchmarks for the most common startup categories.
SaaS (B2B)
B2B SaaS is the most common category for venture-backed startups, and it has well-established TAM benchmarks.
What investors expect: $1B-$10B+ TAM for Series A, $500M+ for seed. The SaaS industry as a whole exceeds $200 billion, so there's room for many large sub-markets.
How to calculate it: Count the number of businesses in your target segment and multiply by your annual contract value (ACV).
Example — Vertical SaaS for dental practices: There are approximately 200,000 dental practices in the US. If your practice management software costs $500/month ($6,000/year), your US TAM is 200,000 × $6,000 = $1.2 billion. Expanding to other English-speaking markets (UK, Canada, Australia) could add another $400M, bringing total TAM to $1.6 billion. This is a credible, venture-backable TAM for a vertical SaaS business.
Typical TAM range for fundable B2B SaaS: $1B-$50B depending on how horizontal or vertical the product is. Horizontal products (project management, CRM, communication) tend toward larger TAMs. Vertical products (dental practice management, construction scheduling) are smaller but often have less competition.
Key insight: In B2B SaaS, TAM expansion often comes from increasing ACV over time (moving upmarket, adding modules) rather than finding more customers. A startup that currently sells a $5,000/year product might have a path to a $25,000/year product through expansion, which 5x's the TAM without finding a single additional customer segment.
Fintech
Fintech TAMs tend to be very large because financial services is one of the biggest industries globally, and because revenue models often involve a percentage of transaction volume, which scales enormously.
What investors expect: $2B+ for seed, $5B-$50B+ for Series A and beyond. Fintech investors are accustomed to large TAMs and will scrutinize your segmentation carefully.
Example — B2B payments for SaaS platforms: There are approximately 30,000 SaaS platforms in the US that process payments on behalf of their users. If each platform processes an average of $2M/year in payments through your infrastructure and your take rate is 0.5%, your revenue per customer is $10,000/year. TAM = 30,000 × $10,000 = $300M. That's relatively small for fintech. But if you expand to include all software platforms globally (estimated 150,000+), the TAM grows to $1.5B+. And if you add adjacent revenue streams (lending, treasury management, fraud prevention), the TAM could expand to $5B+.
Typical TAM range for fundable fintech: $1B-$100B+. The range is enormous because fintech spans everything from niche payment tools to broad banking infrastructure.
Key insight: In fintech, TAM often comes in two parts — a current market size and a "disrupted value" opportunity. If you're replacing a process that currently costs companies $50B/year in fees and inefficiency, your TAM isn't just the market for your software — it's the total value you can capture from the disrupted incumbent model. This "value theory" approach to TAM is common and accepted in fintech.
Healthtech and Digital Health
Healthtech has massive TAMs on paper (the US healthcare system is $4.5 trillion), but investors are cautious about the gap between total market size and what a startup can actually access given regulatory constraints, long sales cycles, and complex buyer dynamics.
What investors expect: $1B-$10B+ for Series A, with a clear explanation of which segment you're addressing and why your specific slice is accessible.
Example — Remote patient monitoring: There are approximately 133 million Americans with at least one chronic condition. If your remote monitoring platform targets the 40 million Medicare patients with congestive heart failure or diabetes, and your platform charges $150/patient/month ($1,800/year), your TAM = 40M × $1,800 = $72 billion. That's enormous, but investors will immediately ask: "How many of those patients are you actually able to reach?" Your SAM and SOM need to be grounded in your distribution strategy (which health systems, which payers, which channels).
Typical TAM range for fundable healthtech: $1B-$20B for the specific segment addressed. Larger claims need to be tightly scoped. "Digital health" as a TAM is too broad; "chronic disease management for Medicare Advantage plans" is specific and credible.
Key insight: In healthtech, the most successful TAM presentations show a focused initial market that's large enough on its own ($1-3B) plus a clear expansion path into adjacent segments. Investors know healthcare adoption is slow, so they want to see a realistic beachhead market, not just the giant number at the top.
E-commerce and DTC
Direct-to-consumer brands and e-commerce platforms have TAMs that vary wildly depending on the product category, price point, and whether you're building a brand or a platform.
What investors expect: $500M-$5B for DTC brands, $1B-$50B+ for e-commerce platforms and infrastructure.
Example — Premium men's grooming DTC brand: The US men's grooming market is approximately $5.5 billion annually. If you're targeting the premium segment (products priced above $30), that's roughly 20% of the market, giving you a TAM of $1.1 billion. This is a defensible, specific TAM that's large enough for venture investment but not so broad that it loses credibility.
Example — E-commerce enablement SaaS: There are approximately 26 million e-commerce stores globally. If you build a shipping optimization tool that charges $200/month ($2,400/year) and targets stores doing $50K-$5M in annual revenue (estimated 4 million stores), your TAM is 4M × $2,400 = $9.6 billion. This is a strong TAM for an e-commerce infrastructure startup.
Key insight: For DTC brands, TAM often feels capped because you're competing in a defined product category. The most compelling DTC TAM stories show category expansion potential: "We're starting in men's grooming ($1.1B) but our brand and distribution model extend to men's wellness ($3B) and personal care ($8B)."
Marketplaces
Marketplaces have a unique TAM dynamic because the total transaction volume flowing through the marketplace (GMV) is much larger than the revenue the marketplace actually captures (take rate × GMV).
What investors expect: $5B+ in GMV opportunity, which translates to $500M-$1B+ in revenue TAM at typical take rates of 10-20%.
Example — Freelance marketplace for video editors: There are approximately 300,000 professional freelance video editors in the US, and the average freelance video editing project is $2,500. If the average editor completes 25 projects per year, total GMV is 300,000 × $2,500 × 25 = $18.75 billion. At a 15% take rate, the revenue TAM is $2.8 billion. That's a compelling marketplace TAM.
Key insight: Marketplace TAM presentations should always show both the GMV opportunity and the revenue TAM. Investors will scrutinize your take rate assumption — if you assume 20% but the industry norm is 10%, your revenue TAM is effectively halved. Benchmark your take rate against comparable marketplaces (Upwork, Fiverr, Etsy, Airbnb) to ensure credibility.
AI and Machine Learning
AI startups face a unique TAM challenge: the market is evolving so rapidly that traditional market sizing based on historical data may understate the opportunity, while hype-driven projections may overstate it.
What investors expect: $1B-$50B+, depending on whether you're building AI infrastructure, vertical AI applications, or AI-enabled services.
Example — AI-powered contract review for legal teams: There are approximately 450,000 law firms in the US, plus corporate legal departments at roughly 50,000 mid-to-large companies. If your contract review tool costs $500/user/month and the average firm or department has 5 users, your TAM is 500,000 organizations × 5 users × $6,000/year = $15 billion. That's a large, specific TAM grounded in identifiable customers.
Key insight: The strongest AI TAM presentations frame the opportunity in terms of the existing spend being replaced or augmented, not in terms of "the AI market." Saying "the global AI market is $500 billion" tells investors nothing about your specific opportunity. Saying "legal teams spend $80 billion annually on contract review, and our AI replaces 40% of that labor" is specific, defensible, and compelling.
EdTech
EdTech TAMs can be substantial but are complicated by the distinction between B2C (individual learners) and B2B (institutional buyers) models, which have very different pricing and sales dynamics.
What investors expect: $500M-$5B for focused EdTech products, $5B+ for platform plays.
Example — Online tutoring marketplace for K-12: There are approximately 50 million K-12 students in the US. If 15% of households use supplemental tutoring (7.5 million students) and average spend is $2,400/year, the TAM is $18 billion. At a 20% marketplace take rate, the revenue TAM is $3.6 billion.
Key insight: EdTech investors are skeptical of consumer willingness to pay because many EdTech products have historically struggled with monetization. A TAM built on premium pricing assumptions ($100+/month per user) needs strong evidence that customers actually pay those rates. Benchmark against existing successful EdTech companies' ARPU to keep your assumptions credible.
TAM Red Flags That Kill Investor Confidence
Investors have pattern-matched on thousands of pitch decks. They can spot a weak TAM analysis instantly. Here are the most common red flags.
"If We Capture Just 1% of This Market..."
This is the single most common TAM mistake, and it immediately signals that the founder hasn't done real market analysis. Investors don't want to hear what happens if you capture an arbitrary percentage. They want to hear how you'll acquire specific customers through specific channels at specific costs. The 1% claim is a top-down fantasy. Replace it with a bottom-up plan.
Claiming an Absurdly Large TAM
If your budgeting app claims a TAM of $300 billion because "the global financial services market is $300 billion," you've lost the room. Your app isn't competing for the entire financial services market. It's competing in the personal finance tools segment, which is a tiny fraction of that number. An oversized TAM signals that you either don't understand your market or you're trying to impress with big numbers instead of rigorous thinking.
Using Only Top-Down Data
Pulling a number from a Gartner report and presenting it as your TAM — without connecting it to your specific product, pricing, and customer base — looks lazy. Investors prefer bottom-up analysis because it shows you've actually thought about who your customers are and what they'll pay. A top-down number can provide context ("The overall market for X is $10B according to Gartner"), but your TAM should be built from your own logic.
Outdated Data
Market data from 2019 is not relevant in 2026. Industries have been reshaped by the pandemic, by AI, by regulatory changes, and by shifting consumer behavior. If your TAM is based on a pre-pandemic report, investors will question everything else in your deck. Use the most current data available and note the publication dates of your sources.
Ignoring Competition in Your TAM
A TAM that doesn't acknowledge competitive dynamics is incomplete. If three well-funded incumbents already control 70% of your TAM, the accessible portion for a new entrant is much smaller. This doesn't mean you shouldn't pursue the market — but your SAM and SOM should reflect the competitive reality.
No Growth Rate
A static TAM is less interesting than a growing one. If your TAM is $2 billion today but growing at 25% annually, it'll be $6 billion in five years. That growth trajectory makes your market dramatically more attractive. Always include growth rate data and cite the source.
When a Small TAM Is Actually Fine
Not every startup needs a $10 billion TAM. There are legitimate paths to building a successful, profitable business with a smaller market — the question is what kind of business you're building and who you're raising from.
Bootstrapped and Lifestyle Businesses
If you're building a profitable business without outside investment, TAM is relevant for strategic planning but there's no minimum threshold. A $50 million TAM niche where you can capture 5% market share ($2.5M revenue) and run a highly profitable team of 10 people is an excellent business. You don't need a venture-scale TAM because you don't need venture-scale returns.
Angel and Micro-VC Funded
Smaller funds (sub-$50M) can generate good returns from smaller exits. A company that captures $10M in annual revenue in a $200M TAM and exits for $80M is an excellent outcome for an angel investor who put in $100K at a $5M valuation. Micro-VCs and angels often specifically look for these "unsexy" niche markets with less competition and higher probability of success.
Vertical SaaS
Vertical SaaS businesses (software built for a specific industry) often have TAMs in the $500M-$2B range, which some VCs consider too small. But vertical SaaS businesses frequently have higher retention rates, lower competition, higher win rates, and a clearer path to market dominance than horizontal plays. Firms like Bessemer and Insight Partners have written extensively about how vertical SaaS can produce excellent outcomes even with "smaller" TAMs, because the combination of high retention and pricing power compensates for the market size ceiling.
Expanding TAM Over Time
Some of the most successful venture-backed companies started with a small TAM and expanded it over time. Uber's initial TAM was the US taxi and limousine market at roughly $4.2 billion. That seemed modest for a venture-backed company. But Uber's real play was to expand the definition of its market — from taxis to ride-sharing to food delivery to logistics — eventually addressing a personal transportation TAM of $5.7 trillion globally. The initial small TAM was a wedge into an enormous opportunity.
If your current TAM is on the smaller side, show investors the expansion path. Start with your beachhead market, then outline the adjacent segments you'll enter as you grow. This "land and expand" TAM narrative is common and credible when it's backed by a clear product roadmap.
How to Present TAM Effectively in Your Pitch Deck
Your market sizing slide is one of the first things investors evaluate, and one of the most common reasons decks get passed on. Here's how to present TAM compellingly.
Use the Nested Circles or Funnel Visual
The classic TAM → SAM → SOM visual (three concentric circles or a funnel) works because it immediately communicates that you understand the difference between total opportunity and realistic capture. Label each circle with the dollar amount and a brief description.
Lead With Bottom-Up, Validate With Top-Down
Present your TAM as a bottom-up calculation ("There are X potential customers, each spending Y per year, for a total TAM of Z"). Then validate it against a top-down reference ("This is consistent with Gartner's estimate of the market at $Z billion"). The bottom-up shows rigor, and the top-down shows awareness of the broader landscape.
Always Include Growth Rate
A $2 billion TAM growing at 30% annually is far more exciting than a $5 billion TAM growing at 3%. Growth rate signals whether you're entering a market with tailwinds or headwinds. Cite the source and the time period.
Show the Expansion Path
Don't just present today's TAM. Show where the TAM goes as your product evolves. "Our current product addresses a $1.5B market. By 2028, with our planned expansion into adjacent use cases, our TAM grows to $4.5B." This gives investors the combination of a credible starting point and an ambitious trajectory.
Be Ready to Defend Every Number
Investors will ask: "How did you get 200,000 potential customers?" or "Why $6,000 per year?" or "What's your source for the 15% growth rate?" Have clear answers. The best founders can walk through their TAM calculation live, adjusting assumptions on the fly during Q&A. That level of fluency signals deep market understanding.
TAM Quick Reference: Benchmarks Summary Table
Here's a consolidated view of the benchmarks covered in this guide for easy reference.
Industry | Typical Fundable TAM | Key Pricing Driver | Growth Rate Range |
|---|---|---|---|
B2B SaaS (Horizontal) | $5B–$50B+ | ACV × number of businesses | 10–25% |
B2B SaaS (Vertical) | $500M–$5B | ACV × businesses in vertical | 8–20% |
Fintech | $2B–$100B+ | Transaction volume × take rate, or subscription | 15–30% |
Healthtech | $1B–$20B | Per-patient or per-provider fees | 12–25% |
E-commerce / DTC | $500M–$5B | Category spend × target segment | 5–15% |
E-commerce Infrastructure | $1B–$20B | SaaS fee × number of stores | 15–25% |
Marketplaces | $500M–$3B revenue ($5B+ GMV) | GMV × take rate | 10–20% |
AI / ML Applications | $1B–$50B+ | Existing spend being replaced or augmented | 25–40% |
EdTech (B2C) | $500M–$5B | Per-learner subscription | 10–20% |
EdTech (B2B/Institutional) | $1B–$10B | Per-seat or per-institution license | 8–15% |
Note that these ranges represent what venture investors typically consider fundable. Many excellent businesses exist outside these ranges — they simply use different funding models (bootstrapping, angel investment, revenue-based financing, etc.).
Frequently Asked Questions
Can my TAM be too big?
Yes. A TAM of $500 billion for a niche productivity tool is a red flag, not an asset. It signals that you defined your market too broadly and haven't thought critically about who your customer actually is. Investors would rather see a $2 billion TAM that you can clearly articulate than a $200 billion TAM that requires multiple leaps of logic. The best TAMs are large enough to support venture outcomes but specific enough to demonstrate genuine market understanding.
What if my TAM is under $1 billion?
You have several options. First, check whether you've defined your market too narrowly — sometimes founders undercount potential customers or underprice their product. Second, look for TAM expansion paths: adjacent segments, geographic expansion, or product line extensions that could grow the opportunity over time. Third, consider whether venture capital is the right funding model. A $500M TAM with 20% margins and low competition might be a better business than a $10B TAM with razor margins and a dozen well-funded competitors. Not every good business needs to be venture-scale.
Should I use top-down or bottom-up TAM?
Both. Start with bottom-up (count customers, multiply by price) because it's the most credible and defensible method. Then cross-reference with a top-down data point from a reputable research firm to validate your number is in the right range. When both methods produce similar results, investor confidence increases significantly. If they diverge wildly, investigate which assumptions are off.
How often should I recalculate my TAM?
At minimum, recalculate annually and before any fundraise. Markets grow, shrink, and reshape constantly. Your TAM from 2024 may not reflect 2026 realities — especially in fast-moving sectors like AI, fintech, and healthtech. If you've expanded your product scope, entered new geographies, or changed your pricing model, your TAM has changed too.
Do angel investors care about TAM as much as VCs?
Angel investors care about TAM, but their threshold is lower because they need smaller outcomes to generate good returns. An angel who invests $50K in a company that reaches $5M in annual revenue and exits for $30M has a great outcome. That math works with a $200M TAM. VCs writing $5M checks need outcomes 10-100x larger, which requires proportionally larger TAMs.
Is TAM different for a marketplace versus a SaaS company?
Yes, fundamentally. SaaS companies measure TAM in direct revenue: number of customers × annual subscription price. Marketplaces measure TAM in GMV (gross merchandise value) and then apply their take rate to calculate revenue TAM. A marketplace with $10B in GMV and a 15% take rate has a $1.5B revenue TAM. Always present both numbers for marketplace businesses so investors can evaluate the take rate assumption.
What about TAM for a product that creates a new category?
When your product creates a category that doesn't have existing market data, use the "value theory" approach. Estimate the value your product delivers to customers (time saved, cost reduced, revenue generated) and use that as the basis for pricing and TAM. Uber did this by reframing from "taxi replacement" ($4.2B market) to "personal transportation" ($5.7T market). The key is to anchor your TAM in the value of the problem you solve, not the size of an existing product category.
A TAM Calculation Checklist
Before including TAM in your pitch deck, run through this checklist to ensure your number is credible and defensible.
Have you built a bottom-up TAM using your own customer count and pricing data? Is your top-down reference from a reputable source published within the last 2 years? Does your TAM accurately reflect your specific product scope (not an overly broad industry)? Have you clearly defined which customer segments are included and excluded? Is your pricing assumption consistent with your actual pricing or validated willingness-to-pay data? Have you included the market growth rate with a cited source? Does your TAM logically cascade into your SAM and SOM? Can you explain how you arrived at every number in your TAM calculation during live Q&A? Have you benchmarked your TAM against comparable funded companies in your space? Does your TAM tell an expansion story that shows where the market goes as your product evolves?
If you can answer yes to all of these, your TAM analysis is in strong shape.
How WorthBuild Calculates Your TAM
Calculating TAM from scratch requires hours of research — finding industry reports, counting potential customers, estimating pricing, and validating against benchmark data. WorthBuild automates this entire process.
When you describe your startup idea, WorthBuild generates a complete market sizing report including TAM, SAM, and SOM calculations built from real market data. The report pulls from search trend data, community discussions, competitive intelligence, and industry databases to estimate customer counts, pricing benchmarks, and market growth rates.
For founders who need a quick, data-backed TAM estimate to evaluate whether an idea is worth pursuing — or a starting point for the more detailed analysis they'll present to investors — WorthBuild provides the foundation in about two minutes.
You can also use the free Market Size Calculator for quick TAM, SAM, and SOM calculations, or validate a full idea with a free report (one per month, no credit card required).
Key Takeaways
A "good" TAM depends on your funding stage and business model. For venture-backed startups, $1 billion or more is the general threshold at Series A, with $500M+ acceptable at seed. Bootstrapped businesses have no minimum.
Investors care more about how you calculated your TAM than the final number. A rigorous bottom-up analysis of a $1.5B market is more compelling than a lazy top-down claim of a $50B market.
TAM expectations vary by industry. SaaS typically needs $1-10B+, fintech $2-50B+, healthtech $1-20B, marketplaces $5B+ in GMV, and AI $1-50B+ depending on the application layer.
Avoid the "1% of a big market" fallacy. Always pair your TAM with a bottom-up SOM calculation that shows how you'll actually acquire customers.
A "small" TAM ($500M-$1B) can still support a great business, especially for vertical SaaS, bootstrapped companies, and startups with a clear TAM expansion story over time.
Always present growth rate alongside your TAM. A growing market with tailwinds is far more attractive than a large but stagnant one.
Your TAM is a story, not just a number. It should demonstrate deep understanding of your customer, your market dynamics, and your path from today's opportunity to tomorrow's bigger one.
Want to calculate your TAM in 2 minutes? Try WorthBuild free — describe your idea and get a data-backed market sizing report with TAM, SAM, SOM, competitor analysis, and an actionable roadmap.