Learn exactly how to calculate your Serviceable Obtainable Market using both top-down and bottom-up methods, with step-by-step formulas, real startup examples, common mistakes to avoid, and a free market size calculator.
You've probably heard the pitch deck cliché: "If we capture just 1% of this $50 billion market…" Investors hear this dozens of times a week, and it makes most of them cringe. Why? Because claiming a percentage of a huge number without showing how you'll actually get there isn't a strategy — it's a fantasy.
That's exactly the problem SOM solves.
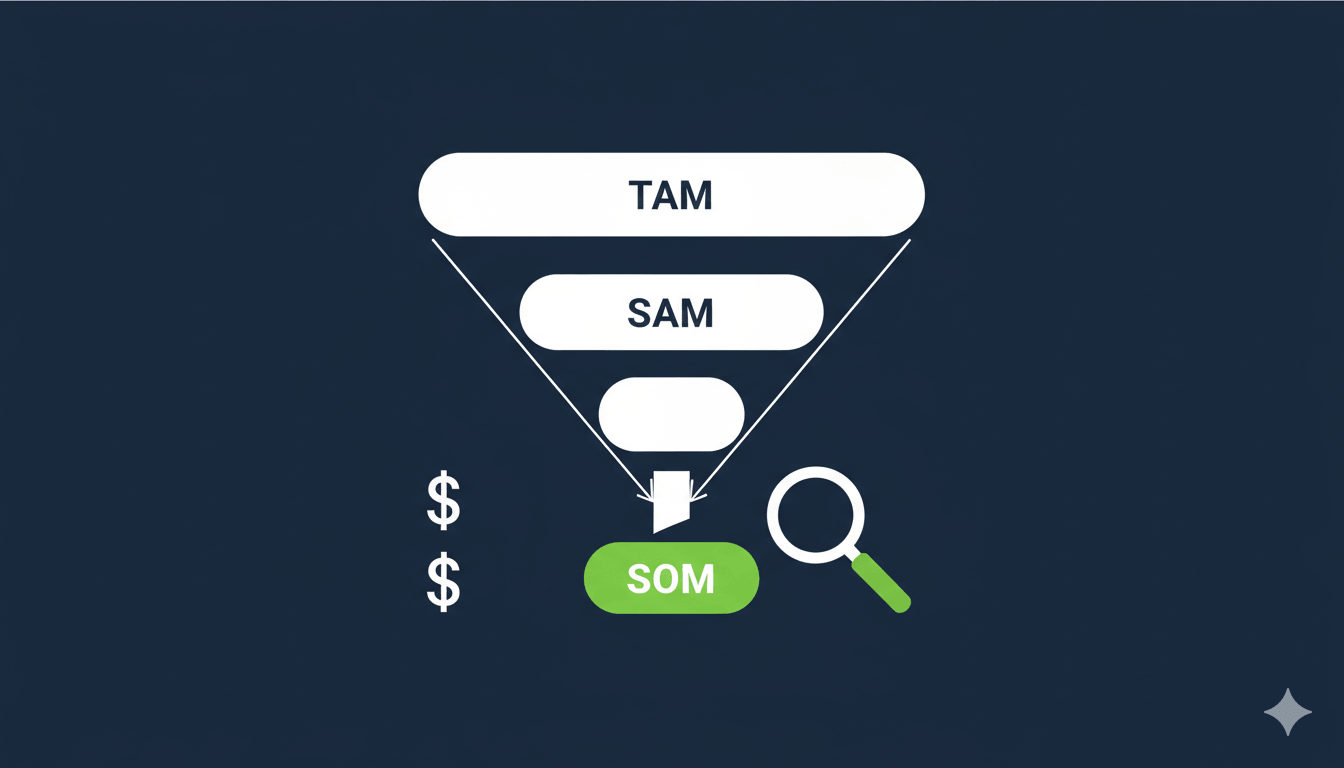
SOM — Serviceable Obtainable Market — is the most grounded, most honest, and most useful number in your entire market sizing analysis. While TAM (Total Addressable Market) tells you how big the ocean is, and SAM (Serviceable Addressable Market) tells you which part of the ocean you could theoretically fish in, SOM tells you how many fish you're actually going to catch this year given your boat, your crew, your bait, and the other boats already out there.
SOM is where ambition meets reality. And for early-stage founders, getting this number right is the difference between a business plan investors take seriously and one that gets politely declined.
In this guide, you'll learn what SOM actually means (and how it differs from TAM and SAM), the exact formulas to calculate it using both top-down and bottom-up methods, step-by-step walkthroughs with real examples, the factors that influence your SOM, common mistakes that destroy credibility with investors, and how to use your SOM to build a growth roadmap that actually works.
What Is SOM (Serviceable Obtainable Market)?
SOM is an estimate of the portion of your serviceable addressable market that your startup can realistically capture in the near term. It's the revenue you can actually expect to generate, given your current resources, competitive landscape, go-to-market strategy, and operational constraints.
Think of it this way: if SAM answers the question "who could we potentially sell to?", SOM answers the much harder question "who will we actually sell to, and how much revenue will that produce?"
SOM is always the smallest of the three market sizing metrics, and that's the point. It's supposed to be conservative. It's supposed to be defensible. A well-calculated SOM tells investors that you understand your market deeply enough to set realistic targets, that you've thought carefully about competition, distribution, and capacity, and that your revenue projections are built on solid assumptions rather than wishful thinking.
How SOM Fits Into the TAM → SAM → SOM Framework
Before diving into calculations, let's make sure the relationship between all three metrics is crystal clear.
TAM (Total Addressable Market) is the total revenue opportunity available if you had 100% market share globally, with no competition and no constraints. It's a theoretical ceiling — the maximum possible size of your market. For example, the global project management software market might be worth $7 billion annually.
SAM (Serviceable Addressable Market) narrows TAM to the segment you can actually serve with your current product, business model, and geographic reach. If your project management tool is built specifically for remote software teams and only supports English, your SAM is the subset of that $7 billion market that fits those criteria — maybe $800 million.
SOM (Serviceable Obtainable Market) narrows SAM further to what you can realistically capture in the short term (typically 1-3 years), given your marketing budget, sales capacity, brand awareness, competitive positioning, and operational limitations. Out of that $800 million SAM, perhaps you can realistically acquire 500 customers at $12,000/year each, putting your SOM at $6 million.
Each metric serves a different purpose. TAM shows investors the total opportunity and whether the market is big enough to be worth pursuing. SAM shows your strategic focus and that you understand who your product is actually for. SOM shows your execution plan and that you can translate opportunity into revenue.
Investors care about all three, but SOM is the number they'll pressure-test most heavily, because it's the one that has to line up with your financial projections.
The SOM Formula: Two Approaches
There are two primary ways to calculate SOM, and the best practice is to use both and check whether they produce consistent results.
Method 1: The Market Share Method (Top-Down)
This is the more common formula, and it works best for companies that already have some revenue history.
SOM = Last Year's Market Share % × This Year's SAM
Here's how it breaks down step by step:
Step 1: Calculate your market share from last year. Divide your company's revenue from the previous year by your SAM from that same year.
Market Share % = (Your Revenue Last Year / Last Year's SAM) × 100
Step 2: Multiply your market share by this year's SAM. This gives you a projection of what you can expect to capture this year, assuming your competitive position holds steady.
SOM = Market Share % × This Year's SAM
Worked example — B2B SaaS for restaurants:
Let's say you run a SaaS tool that helps restaurants manage online orders. Last year, the SAM for your product (English-speaking restaurants in the US with online ordering, 50+ monthly orders) was $400 million. Your company generated $2 million in revenue.
Step 1: Market Share = ($2M / $400M) × 100 = 0.5%
This year, the SAM has grown to $440 million (10% market growth from increased online ordering adoption).
Step 2: SOM = 0.5% × $440M = $2.2 million
That $2.2 million is your baseline SOM — what you can expect if you maintain your current market share in a growing market. Of course, if you're investing more in sales and marketing this year, you might reasonably argue for a higher market share percentage, but you'd need to justify why (more on that later).
When to use this method: When you have at least one year of revenue data and a reliable SAM estimate. This is the method investors find most credible for post-revenue startups because it's grounded in actual performance.
Method 2: The Bottom-Up Method
This approach builds your SOM from the ground up using your actual operational capacity, sales pipeline, and go-to-market plan. It's more labor-intensive but produces a more defensible number, especially for pre-revenue startups that can't use the market share formula.
SOM = Number of Reachable Customers × Conversion Rate × Average Revenue Per Customer
Here's how it breaks down:
Step 1: Identify your reachable customers. This isn't everyone in your SAM. It's the number of potential customers you can actually reach with your current marketing channels, sales team, and budget. Be specific — which channels will you use, what's your estimated reach on each, and how many prospects does that put in your funnel?
Step 2: Estimate your conversion rate. Of the prospects you reach, what percentage will actually convert to paying customers? If you have existing data, use it. If you're pre-launch, use industry benchmarks (SaaS typically sees 2-5% trial-to-paid conversion for self-serve, 10-20% for sales-assisted).
Step 3: Multiply by average annual revenue per customer. This is your pricing — the average amount each customer will pay you per year.
Worked example — Email marketing tool for e-commerce:
You're building an email marketing platform specifically for Shopify merchants. Here's your bottom-up SOM calculation:
Your SAM: There are approximately 2 million active Shopify stores. After filtering for stores with at least $10K/month in revenue (your target segment), you estimate 300,000 qualifying stores. At your $200/month pricing ($2,400/year), your SAM is $720 million.
Now for SOM:
Step 1 — Reachable customers: In Year 1, you plan to run content marketing targeting Shopify merchants (estimated reach: 50,000 unique visitors/month), a Shopify App Store listing (estimated 15,000 views/month), and targeted LinkedIn and Facebook ads with a $5,000/month budget (estimated reach: 20,000/month). After deduplication and accounting for overlap, you estimate reaching approximately 60,000 unique potential customers over the year.
Step 2 — Conversion: Based on industry benchmarks for app-store-listed SaaS tools, you estimate a 2% conversion rate from awareness to paid customer. That gives you: 60,000 × 2% = 1,200 paying customers.
Step 3 — Revenue per customer: At $200/month ($2,400/year), your SOM is: 1,200 × $2,400 = $2.88 million.
Why this method is powerful: Every single number in this calculation can be questioned, tested, and defended. An investor can ask "Why 2% conversion?" and you can point to Shopify App Store benchmarks. They can ask "Why 60,000 reach?" and you can show your channel-by-channel breakdown. There's no hand-waving — it's all traceable to specific assumptions.
When to use this method: Always, but especially when you're pre-revenue or in your first year. Even post-revenue startups should run a bottom-up SOM alongside the market share method to cross-validate their projections.
Using Both Methods Together
The smartest approach is to calculate SOM both ways and compare the results. If the top-down method gives you $2.2 million and the bottom-up gives you $2.88 million, you're in a credible range. If one method gives you $2 million and the other gives you $20 million, something is wrong with your assumptions and you need to investigate which inputs are off.
When the two methods converge on a similar number, investors gain much more confidence in your projections. It shows you've approached the problem from multiple angles and arrived at a consistent answer.
Factors That Influence Your SOM
Your SOM isn't just a mathematical output — it's shaped by real-world constraints and advantages that you need to understand and account for. Here are the major factors.
1. Competitive Landscape
The number and strength of competitors in your SAM directly impacts how much of it you can capture. A market with two weak competitors is very different from a market with five well-funded incumbents.
When assessing competition for your SOM, consider how many direct competitors are serving your exact target segment, what their market share is (individually and collectively), how differentiated your product is compared to theirs, and what switching costs exist for customers currently using a competitor.
Example: If there are four competitors in your SAM and they collectively hold 80% market share, the remaining 20% is effectively the ceiling for new entrants. Your SOM should reflect a realistic portion of that accessible 20%, not a percentage of the total SAM.
2. Sales and Marketing Budget
Your SOM is directly constrained by how much you can afford to spend acquiring customers. A startup with $500K in marketing budget will have a fundamentally different SOM than one with $50K, even if they're targeting the same SAM.
Map your budget to specific acquisition channels and estimate the cost per acquisition (CPA) for each. Your total budget divided by your average CPA gives you the maximum number of customers you can acquire — which puts a hard ceiling on your SOM.
Example: If your average CPA is $300 and your annual marketing budget is $150,000, you can acquire at most 500 customers. At $3,000/year per customer, that's a SOM of $1.5 million. No amount of market opportunity changes this number until your budget changes.
3. Sales Team Capacity
For products with a sales-assisted or enterprise sales motion, your team's capacity is a binding constraint. Each sales rep can only handle a finite number of deals per quarter.
Example: If you have 3 sales reps, each can close an average of 5 deals per month, and your average deal size is $15,000/year, your SOM from the sales channel alone is: 3 reps × 5 deals × 12 months × $15,000 = $2.7 million.
4. Product Readiness and Distribution
If your product only supports one language, only integrates with certain platforms, or only works in specific regulatory environments, these are hard constraints on your SOM. A CRM that only integrates with Salesforce can't capture customers running HubSpot. A fintech tool that's only licensed in the US can't count European customers in its SOM.
Be honest about these limitations. They're not weaknesses — they're focus. And investors would much rather see a founder who acknowledges constraints than one who hand-waves them away.
5. Brand Awareness and Trust
In the early stages, nobody knows who you are. That's a real constraint on SOM. Customers in your SAM might be perfect fits for your product, but if they've never heard of you and they're already using a known alternative, you need a compelling reason (and a reachable channel) to get their attention.
This is why bottom-up SOM calculations that start with "reachable customers" rather than "total addressable customers" are so much more credible. They account for the awareness gap.
6. Market Growth Rate
If your SAM is growing at 15% annually, your SOM benefits even if your market share stays flat. Conversely, if the market is contracting, maintaining the same market share means your SOM shrinks in absolute terms.
Always factor in the direction the market is moving. A 0.5% market share in a market growing 20% year-over-year is a very different story than 0.5% in a stagnant or declining market.
SOM Calculation: Complete Walkthrough With a Real-World Example
Let's bring everything together with a detailed, end-to-end example that shows both calculation methods for the same startup.
The Scenario
You're building a SaaS tool called "InvoiceBot" — an AI-powered invoicing and payment collection platform built specifically for freelance designers and developers. You launched 8 months ago, you have 200 paying customers, and you're charging $30/month ($360/year).
Step 1: Establish Your TAM
Research shows there are approximately 73 million freelancers in the US. Of those, roughly 15 million are in professional services (design, development, writing, consulting) where invoicing is a regular activity. Average spend on business tools is approximately $1,200/year per freelancer.
TAM = 15 million freelancers × $1,200/year = $18 billion
This is the broadest possible view — all professional freelancers, all business tools.
Step 2: Narrow to Your SAM
InvoiceBot is specifically an invoicing tool (not all business tools), it targets designers and developers (not all professional freelancers), and it's currently English-only and US-only.
There are approximately 2.5 million freelance designers and developers in the US. The average spend on invoicing and payment tools specifically is about $400/year.
SAM = 2.5 million × $400/year = $1 billion
Step 3: Calculate SOM — Market Share Method
Your revenue over the past 8 months: 200 customers × $30/month × 8 months = $48,000. Annualized, that's approximately $72,000 (200 × $360).
Last year's SAM (estimating it was roughly the same): $1 billion.
Market Share = $72,000 / $1,000,000,000 = 0.0072%
If the SAM grows 8% this year to $1.08 billion:
SOM (maintaining share) = 0.0072% × $1.08B = $77,760
That's your baseline — what happens if nothing changes. But you're a growing startup, so let's also look at a growth scenario. If you triple your market share (reasonable for an early-stage company investing in growth):
SOM (growth scenario) = 0.0216% × $1.08B = $233,280
Step 4: Calculate SOM — Bottom-Up Method
Now let's build it from the ground up.
Reachable customers: You plan to reach freelancers through a Dribbble and Behance sponsorship campaign (reaching ~100,000 freelance designers), SEO content targeting "invoicing for freelancers" keywords (estimated 40,000 organic visitors/year), a Product Hunt launch and Indie Hackers community presence (estimated 30,000 impressions), and referrals from existing customers (estimated 50 referrals from 200 customers, assuming a 25% referral rate). After deduplication, your estimated unique reach is approximately 150,000 freelance designers and developers over the next 12 months.
Conversion rate: Your current trial-to-paid conversion is 4% (based on 8 months of data). Assuming some improvement from onboarding optimization, you project 4.5%.
New customers: 150,000 × 4.5% = 675 new customers.
Total customers by year end: 200 existing + 675 new = 875 (assuming 10% annual churn on existing customers, so 180 retained + 675 new = 855).
Revenue per customer: $360/year.
SOM = 855 × $360 = $307,800
Step 5: Compare and Reconcile
The market share method (growth scenario) gave you ~$233K. The bottom-up method gave you ~$308K. These are in the same ballpark, which is a good sign. The bottom-up is slightly higher because it bakes in specific growth initiatives (sponsorships, Product Hunt launch) that the market share method doesn't account for.
For your pitch deck, you could credibly present a SOM of approximately $250K-$300K for Year 1, noting that this is based on both historical performance and a channel-by-channel growth plan.
How SOM Shapes Your Growth Roadmap
SOM isn't just a number for your pitch deck — it's a strategic planning tool. Here's how to use it beyond fundraising.
Setting Quarterly Revenue Targets
If your annual SOM is $300K, that breaks down to $75K per quarter. But growth isn't linear — your Q1 might be $50K while your Q4 is $100K as marketing efforts compound. Use your SOM to set quarterly milestones and track whether you're on pace.
Working Backward to Pipeline Requirements
If your average deal is $360/year and your conversion rate is 4.5%, you need approximately 22 qualified leads to close one customer. To hit 675 new customers, you need about 15,000 qualified leads over the year — roughly 1,250 per month. Does your marketing plan support that volume? If not, either your SOM is too aggressive or your marketing plan needs more investment.
Prioritizing Channels
Your bottom-up SOM calculation forces you to estimate the contribution of each channel. If Dribbble sponsorships are projected to deliver 40% of your reach but consume 60% of your budget, that might not be efficient. SOM planning helps you identify which channels offer the best return and where to reallocate resources.
Planning Market Expansion
Once you've captured a meaningful share of your initial SOM, the question becomes: where do you expand? Your SOM naturally suggests expansion paths. In the InvoiceBot example, obvious next moves include expanding to non-English markets (increasing SAM and therefore SOM potential), adding features for other freelance verticals (writers, consultants, photographers), and moving upmarket to small agencies (higher ACV, different SAM segment).
Each expansion path has its own SOM calculation. Running the numbers for each helps you prioritize which direction offers the best risk-adjusted return.
SOM for Pre-Revenue Startups
If you haven't launched yet and have zero revenue, you can't use the market share method. But you can absolutely calculate a credible SOM using the bottom-up approach — you just need to be more transparent about which numbers are estimates versus data.
Here's a framework for pre-revenue SOM:
Start with your launch plan. Where will your first customers come from? Be specific: "We'll launch on Product Hunt, post in 5 relevant subreddits, run a $2,000 Google Ads campaign targeting 'invoicing software for freelancers,' and do direct outreach to 500 freelancers from our network."
Estimate reach for each channel. Use publicly available benchmarks. Product Hunt launches in the productivity category typically get 3,000-10,000 views. Google Ads for SaaS keywords might cost $3-8 per click. Reddit posts in niche communities might get 500-2,000 views.
Apply conservative conversion rates. For a product nobody has heard of with no social proof, use the low end of industry benchmarks. If SaaS trials typically convert at 3-7%, use 2-3%. You can always revise upward once you have real data.
Calculate your Year 1 SOM. Multiply reachable prospects × conversion rate × annual revenue per customer. Then clearly label which numbers are based on data and which are assumptions.
Example: A pre-revenue task management app targeting freelance writers:
Reachable prospects in Year 1: 40,000 (via content marketing, community posts, and a $3,000/month ad budget). Conservative conversion rate: 2%. New customers: 800. Price: $15/month ($180/year). Year 1 SOM: 800 × $180 = $144,000.
This is a small number, and that's fine. It's credible. It shows you've done the work. And it gives investors a foundation to discuss growth scenarios: "What happens if conversion improves to 4%? What if you 5x the marketing budget after a seed round?"
Common SOM Mistakes That Kill Credibility
Mistake 1: The "1% of a Big Market" Fallacy
This is the most common and most damaging mistake. Saying "the market is $10 billion, and if we capture just 1%, that's $100 million" sounds impressive but tells investors nothing about how you'll actually acquire customers. It's a top-down assumption disguised as a plan. Always pair a percentage claim with a bottom-up justification that shows the path to getting there.
Mistake 2: Confusing SAM with SOM
Your SAM is everyone you could potentially sell to. Your SOM is everyone you will sell to given your current constraints. These are very different numbers. A startup that presents its SAM as its SOM is signaling that it doesn't understand its own limitations — which is a major red flag for investors.
Mistake 3: Ignoring Competition Entirely
If your SOM calculation doesn't account for competitors, it's not a SOM — it's a SAM with a different label. You need to explicitly address how many competitors are serving your target segment, what share they hold, and why customers would choose you over them.
Mistake 4: Using Unrealistic Conversion Rates
Assuming 10% conversion from website visitor to paying customer might sound conservative, but for most SaaS products, 2-5% is realistic for self-serve and 10-20% for sales-qualified leads. Using inflated conversion rates makes your entire SOM calculation fall apart under scrutiny.
Mistake 5: Not Accounting for Churn
If you're projecting 1,000 new customers but losing 15% of your existing base annually, your net customer count is lower than your gross acquisition. SOM should reflect net revenue, not just new revenue. Factor in churn from the start.
Mistake 6: Static SOM Thinking
Your SOM isn't fixed. It changes as you raise funding (more marketing budget), launch new features (broader appeal), expand geographically (larger SAM), build brand awareness (higher conversion rates), and improve your product (lower churn). Recalculate your SOM every quarter as these variables shift.
SOM Benchmarks: What's Realistic?
One of the hardest questions founders face is: "What's a realistic market share for a startup?" There's no universal answer, but here are some guidelines based on market maturity and competitive intensity.
New market with few competitors: A startup entering a nascent market with 1-2 other players can realistically target 5-15% of SAM within 3-5 years. The market is still being defined, customers are actively searching for solutions, and switching costs are low because nobody is deeply entrenched yet.
Established market with moderate competition: In a market with 5-10 serious competitors, capturing 1-5% of SAM within 3-5 years is ambitious but achievable for a well-funded startup with a differentiated product.
Crowded market with dominant incumbents: If 2-3 players already hold 70%+ of the market, a new entrant should expect to capture 0.1-1% of SAM in the first few years. The path to growth here is usually finding an underserved niche within the SAM and dominating that before expanding.
For Year 1 specifically: Most startups capture less than 0.1% of their SAM in the first year. That's normal. Don't inflate your Year 1 SOM to impress investors — a small but well-justified number is far more credible than a large but unsupported one.
How to Present SOM in Your Pitch Deck
Your market sizing slide is one of the most scrutinized slides in any pitch deck. Here's how to present SOM effectively.
Show all three metrics together. Present TAM, SAM, and SOM as a clear funnel, with each metric smaller than the last. A simple visual — three concentric circles or a funnel diagram — works well. Label each with the dollar amount and a brief description of how you arrived at it.
Lead with bottom-up SOM. When you discuss SOM, start with the bottom-up calculation. Walk through your channels, reach estimates, conversion assumptions, and pricing. This shows investors you have a real go-to-market plan, not just a spreadsheet exercise.
Show a SOM growth trajectory. Present SOM for Year 1, Year 2, and Year 3. Show what changes between years — new channels, expanded geography, additional product lines — and how each change impacts the SOM calculation. This tells a compelling growth story grounded in specifics.
Be ready to defend every assumption. Investors will ask "Why 3% conversion?" or "How do you know you can reach 50,000 prospects?" Have data, benchmarks, or at minimum a clear rationale for every number in your SOM.
Don't hide behind TAM. Some founders spend their entire market sizing discussion on TAM because it's the biggest, most impressive number. Experienced investors will skip straight to SOM and ask how you plan to convert opportunity into revenue. Make SOM the star of your market sizing narrative.
SOM by Industry: What Good Looks Like
SOM calculations vary significantly by industry because customer acquisition dynamics, pricing models, and competitive structures are fundamentally different. Here's what realistic SOM looks like across several common startup categories.
SaaS (B2B)
B2B SaaS startups typically have higher revenue per customer but longer sales cycles. A seed-stage B2B SaaS company might realistically target 50-200 customers in Year 1, depending on whether it uses self-serve or sales-assisted distribution.
Realistic Year 1 SOM range: $100K–$1M
Key SOM driver: Sales team capacity and average contract value. A single enterprise rep closing 3-4 deals per quarter at $25K ACV generates $75K-$100K per quarter. Your SOM scales almost linearly with headcount at this stage.
Example: A compliance automation tool for fintech startups. SAM: 5,000 fintech startups in the US needing compliance tools. Year 1 reach via content marketing and conference sponsorships: 2,000. Conversion: 3%. Customers: 60. ACV: $18,000. SOM: $1.08M.
SaaS (B2C / Prosumer)
Consumer-facing SaaS has lower price points but can achieve much higher volumes through self-serve distribution and virality.
Realistic Year 1 SOM range: $50K–$500K
Key SOM driver: Organic acquisition channels and trial-to-paid conversion rate. Products with strong word-of-mouth mechanics (like Notion or Canva early on) can punch well above their marketing budget.
Example: A budgeting app for Gen Z. SAM: 20 million Gen Z adults in the US who use financial apps. Year 1 reach via TikTok content and App Store optimization: 500,000. Trial download rate: 8%. Trial-to-paid conversion: 3%. Paying users: 1,200. Price: $5/month ($60/year). SOM: $72,000.
E-commerce / DTC
Direct-to-consumer brands have high customer acquisition costs and razor-thin margins, which means SOM is heavily constrained by ad spend efficiency.
Realistic Year 1 SOM range: $200K–$2M
Key SOM driver: Customer acquisition cost (CAC) relative to average order value (AOV) and repeat purchase rate. A brand with a $30 CAC and $80 AOV can scale profitably. A brand with a $50 CAC and $40 AOV will burn through its marketing budget.
Example: An eco-friendly pet food brand selling DTC. SAM: $4 billion US premium pet food market. Year 1 ad budget: $120K. Average CAC: $40. New customers: 3,000. Average annual spend: $360. SOM: $1.08M.
Marketplace
Two-sided marketplaces face the cold-start problem, which makes Year 1 SOM especially conservative. You need both supply and demand, and neither side joins without the other.
Realistic Year 1 SOM range: $50K–$300K (in transaction volume / take rate)
Key SOM driver: Geographic density and take rate. Most successful marketplaces start hyperlocal and dominate one market before expanding.
Example: A marketplace connecting freelance videographers with small businesses. SAM: 200,000 small businesses in your metro area that need video content. Year 1: focus on one city, reach 5,000 businesses through local SEO and direct outreach. Conversion to first transaction: 4%. Active buyers: 200. Average annual spend: $3,000. Platform take rate: 15%. SOM: 200 × $3,000 × 15% = $90,000.
Advanced SOM Techniques
Once you've mastered the basic SOM calculation, there are several advanced techniques that can make your analysis more sophisticated and more useful.
Scenario Modeling
Rather than presenting a single SOM number, build three scenarios: conservative (low reach, low conversion, high churn), base case (your best estimates), and optimistic (everything goes right — successful product launch, viral moment, lower-than-expected CAC). Present all three to investors. This shows intellectual honesty and gives them a range to evaluate.
Cohort-Based SOM
Instead of treating all customers as one group, calculate SOM by customer cohort or segment. You might find that enterprise customers have a much higher lifetime value and lower churn, making them a more attractive SOM segment even if they're harder to acquire. Breaking SOM by cohort helps you prioritize which segments to target first.
Time-Phased SOM
Build a month-by-month SOM model for Year 1 rather than just an annual number. This accounts for the reality that growth compounds — your Month 12 acquisition rate will likely be much higher than Month 1 as your content ranks, your brand builds, and your conversion funnel improves. A time-phased model also gives you monthly targets to track against.
Competitive SOM Analysis
Estimate each competitor's SOM within your SAM. If you can approximate their customer count and pricing (from job postings, review sites, press releases, or traffic estimates), you can build a competitive landscape map showing how the SAM is currently divided. The "white space" — the portion of SAM not captured by any existing player — is your most addressable opportunity.
How WorthBuild Helps You Size Your Market
Calculating TAM, SAM, and SOM from scratch requires hours of research — finding market reports, estimating customer counts, analyzing competitors, and building financial models. WorthBuild compresses that process into about two minutes.
When you describe your startup idea, WorthBuild generates a complete market sizing analysis including TAM, SAM, and SOM estimates based on real market data from search trends, community discussions, competitor landscapes, and industry databases. The report also includes competitor analysis (so you can assess competitive intensity for your SOM), unit economics projections, and a risk assessment.
For founders who want to quickly validate whether their market is large enough to pursue — and get a realistic sense of what they could capture — WorthBuild provides the data foundation you'd otherwise spend days assembling manually.
You can also use the free Market Size Calculator to run quick TAM, SAM, and SOM calculations, or validate a full idea with a free report (one per month, no credit card required).
Key Takeaways
SOM is the portion of your serviceable addressable market you can realistically capture in the near term — it's the most important number in your market sizing analysis because it connects market opportunity to actual revenue.
Use two methods: the market share method (last year's share × this year's SAM) for post-revenue startups, and the bottom-up method (reachable customers × conversion rate × revenue per customer) for everyone. Run both and compare.
Your SOM is constrained by real-world factors: marketing budget, sales capacity, competitive landscape, product readiness, brand awareness, and market growth rate. Account for all of them.
For Year 1, most startups capture less than 0.1% of their SAM. A small, well-justified SOM is infinitely more credible than a large, unsupported one.
Avoid the "1% of a big market" trap. Investors see through it immediately. Always pair top-down percentages with bottom-up justification.
Recalculate SOM quarterly as your resources, product, and market position evolve. It's a living metric, not a one-time exercise.
Present SOM as the centerpiece of your pitch deck's market sizing slide. Lead with the bottom-up calculation, show a multi-year growth trajectory, and be prepared to defend every assumption.
Want to calculate your TAM, SAM, and SOM in 2 minutes? Try WorthBuild free — describe your idea and get a data-backed market sizing report with competitor analysis, unit economics, and an actionable roadmap.